Generally speaking, when there is too much supply of oil compared to what the world needs on any given day, the price per barrel will go down. Likewise, when oil supply fails to keep up with what the world market demand on any given day, the price goes up.
Over the past decade or so, oil prices reached historic low levels due to the growing, oil-thirsty economies of China, India, and other developing countries. Prices well over $100 per barrel reflected the growing demand, and higher prices for consumers at the pump, as well as for consumer goods like food and clothing. The low prices also meant lower government revenues for oil exporting states in the Middle East, Russia, and in Latin America. These states base much of their budget on income from their oil exports.
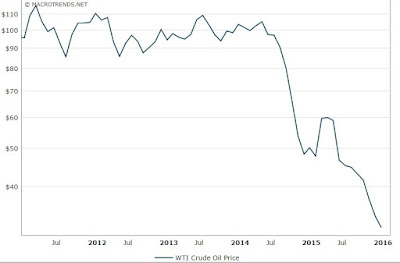
Since the June 2014 start of the crude oil price collapse, the average monthly price has fallen from $105 high to $31.33 as of 1 February 2016. As the timeline chart shows below, there are small spikes in the price over time, yet the overall trend has been lower prices.
 |
| Crude Oil Price Collapse from July 2014 (Source: Macrotrends.net) |
Energy analysts note that the low prices are likely to stick around for 2016. Below, the animated video below from Bloomberg Business offers a few discussion points of what the energy sector will look like in the upcoming year, and beyond.
Why 2016 Could Be a Turning Point in the Energy Revolution (Source: YouTube, Bloomberg Business)